Data. What is it good for?

With the release of the 2023 NAPLAN results to schools last week, coinciding with the majority of schools publishing mid-year academic reports, student, teacher, and school performance is hot on the agenda and front of mind for many parents.
So, you might be wondering what teachers at St Catherine’s actually do with all the data we receive?
Student progress can be mapped in a myriad of ways using a wide variety of data sources.
At St Catherine’s, we place a high value on the observations and assessments conducted by the classroom teacher. After all, they know their students best, and know when they are performing at their best.
Teachers also have a deep understanding of how individual students are progressing compared to other students in the same class and Year level. They know how they are progressing compared to other cohorts of years gone past and they know how to make adjustments to respond to this progress – to either stretch or support as required.
The external testing completed at St Catherine’s on the other hand, provides teachers and School leaders with a one-point observation. That is, how the students performed on one test, administered on one particular day.
This kind of testing is useful if we want a snapshot of our Cohorts and to compare them to other similar-aged cohorts from around Australia. This can be helpful when evaluating programs or if looking to identify gaps in learning that otherwise might not have been evident with internal testing.
The external assessments conducted at St Catherine’s includes NAPLAN (Years 3, 5, 7, 9), AAS (Years 8, 10), and other individual assessments conducted on an as-needs basis.
It is important to keep in mind that such scores are only one part of a student’s education. What external testing does not show is short-term progress. It does not show the full picture of the whole child, nor does it measure a student’s potential or mindset.
At St Catherine’s, we place far greater value on the character dispositions which are woven into all areas of a student’s experience whilst in our care. They are at all times encouraged to be Bold, Creative, Independent, and Resilient.
In many respects this is a far more valuable marker for student progress and growth than any one-point testing result. Education extends far beyond progress made in academics and skills-based learning.
So, what does St Catherine’s do with all this data?
After each round of internal or external testing is completed, the data is made available to various Leaders in the School to analyse. The exact type of analysis will vary based on each Leader’s portfolio. For example, a Head of Year will likely be interested in the overall progress of individual students in terms of who needs extending, who needs support, who is tracking up or down?
Whereas the Mathematics Faculty might focus on the scores in numeracy and ensure all students have a thorough understanding of a particular skill. Or the English Faculty might target students of a particular Year level for a spelling program.
What can the data look like?
The best use of data comes when we use it as a comparative tool.
For example, a graph showing a particular Year level’s GPA (Grade Point Average) scores, that is the overall average score based on the average scores obtained in each subject for each student in that year, could be displayed as a boxplot like this:
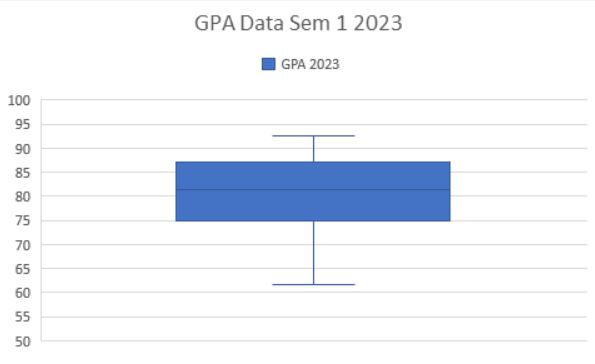 NOTE: Any outliers present have been excluded from both this boxplot and future boxplots shown in this article.
Mildly interesting.
Yet, if we now put that same boxplot on a scale as the average GPAs for students of the same Year level over the previous two years, we now can start making some meaningful observations.
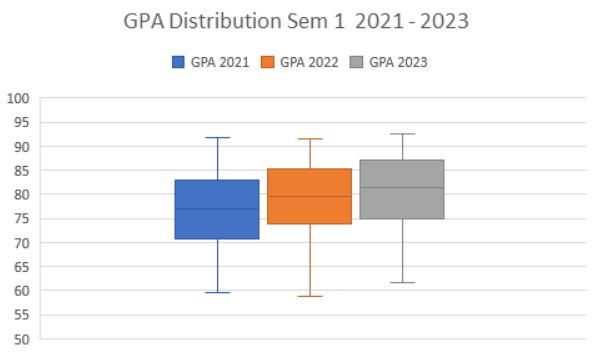
Observe the median line (the horizontal line in the middle of the box). This is the middle value of GPAs for that Year level, meaning that half of the students scored above this value, and half of the students scored below this value.
The interesting part is that this value is increasing!
But is this increase just a result of random variation? Or can we use data from other years to help explain what might be happening with our students’ overall progress?
When plotting the graphs of other Year levels, we found similar trends across every Cohort. The median GPA scores had all increased.
This indicates that there is an association between year and average GPA scores. The change is unlikely to be the result of random variation. That is, GPA scores at Years 7 to 10 have increased from 2020 to 2022.
This is great news.
We do not rest there though.
The next step is to look at the external data to see if this increasing trend is just a reflection of internal marks, or if the students are also displaying an increase in particular competencies when compared to other cohorts from across Australia.
That analysis is trickier to conduct as we are no longer comparing apples with apples. Internal GPA data is measuring something completely different to external NAPLAN and AAS testing.
However, it is clear from the external data that in general the reasoning skills and overall performance in Mathematics and English are indeed increasing, allowing our School Leaders to draw the conclusion that our academic programs and interventions are having a positive effect of student outcomes.
For a school with already exceptionally high academic achievement at Year 12, this small-scale analysis is very encouraging.
Where to from here?
The Middle Leaders (Heads of Year and Heads of Faculty) will meet to evaluate and review the data with their deep knowledge of students, curriculum and how students learn. From this, deeper analysis will be undertaken to draw further conclusions and inform future planning.
Together, our team will unpack why this performance increase might be happening so our teachers can know with confidence where the success is coming from. This allows our School to review our academic care, curriculum, and student programs with a focus on evidence informed decision making.
Through this data and its analysis by our expert educators we can ensure the right distribution of School resources into our programs for all the right reasons. Most importantly, the data and subsequent analysis allows us to continue to deliver optimum academic care for every student that is purposeful and differentiated.